
Index
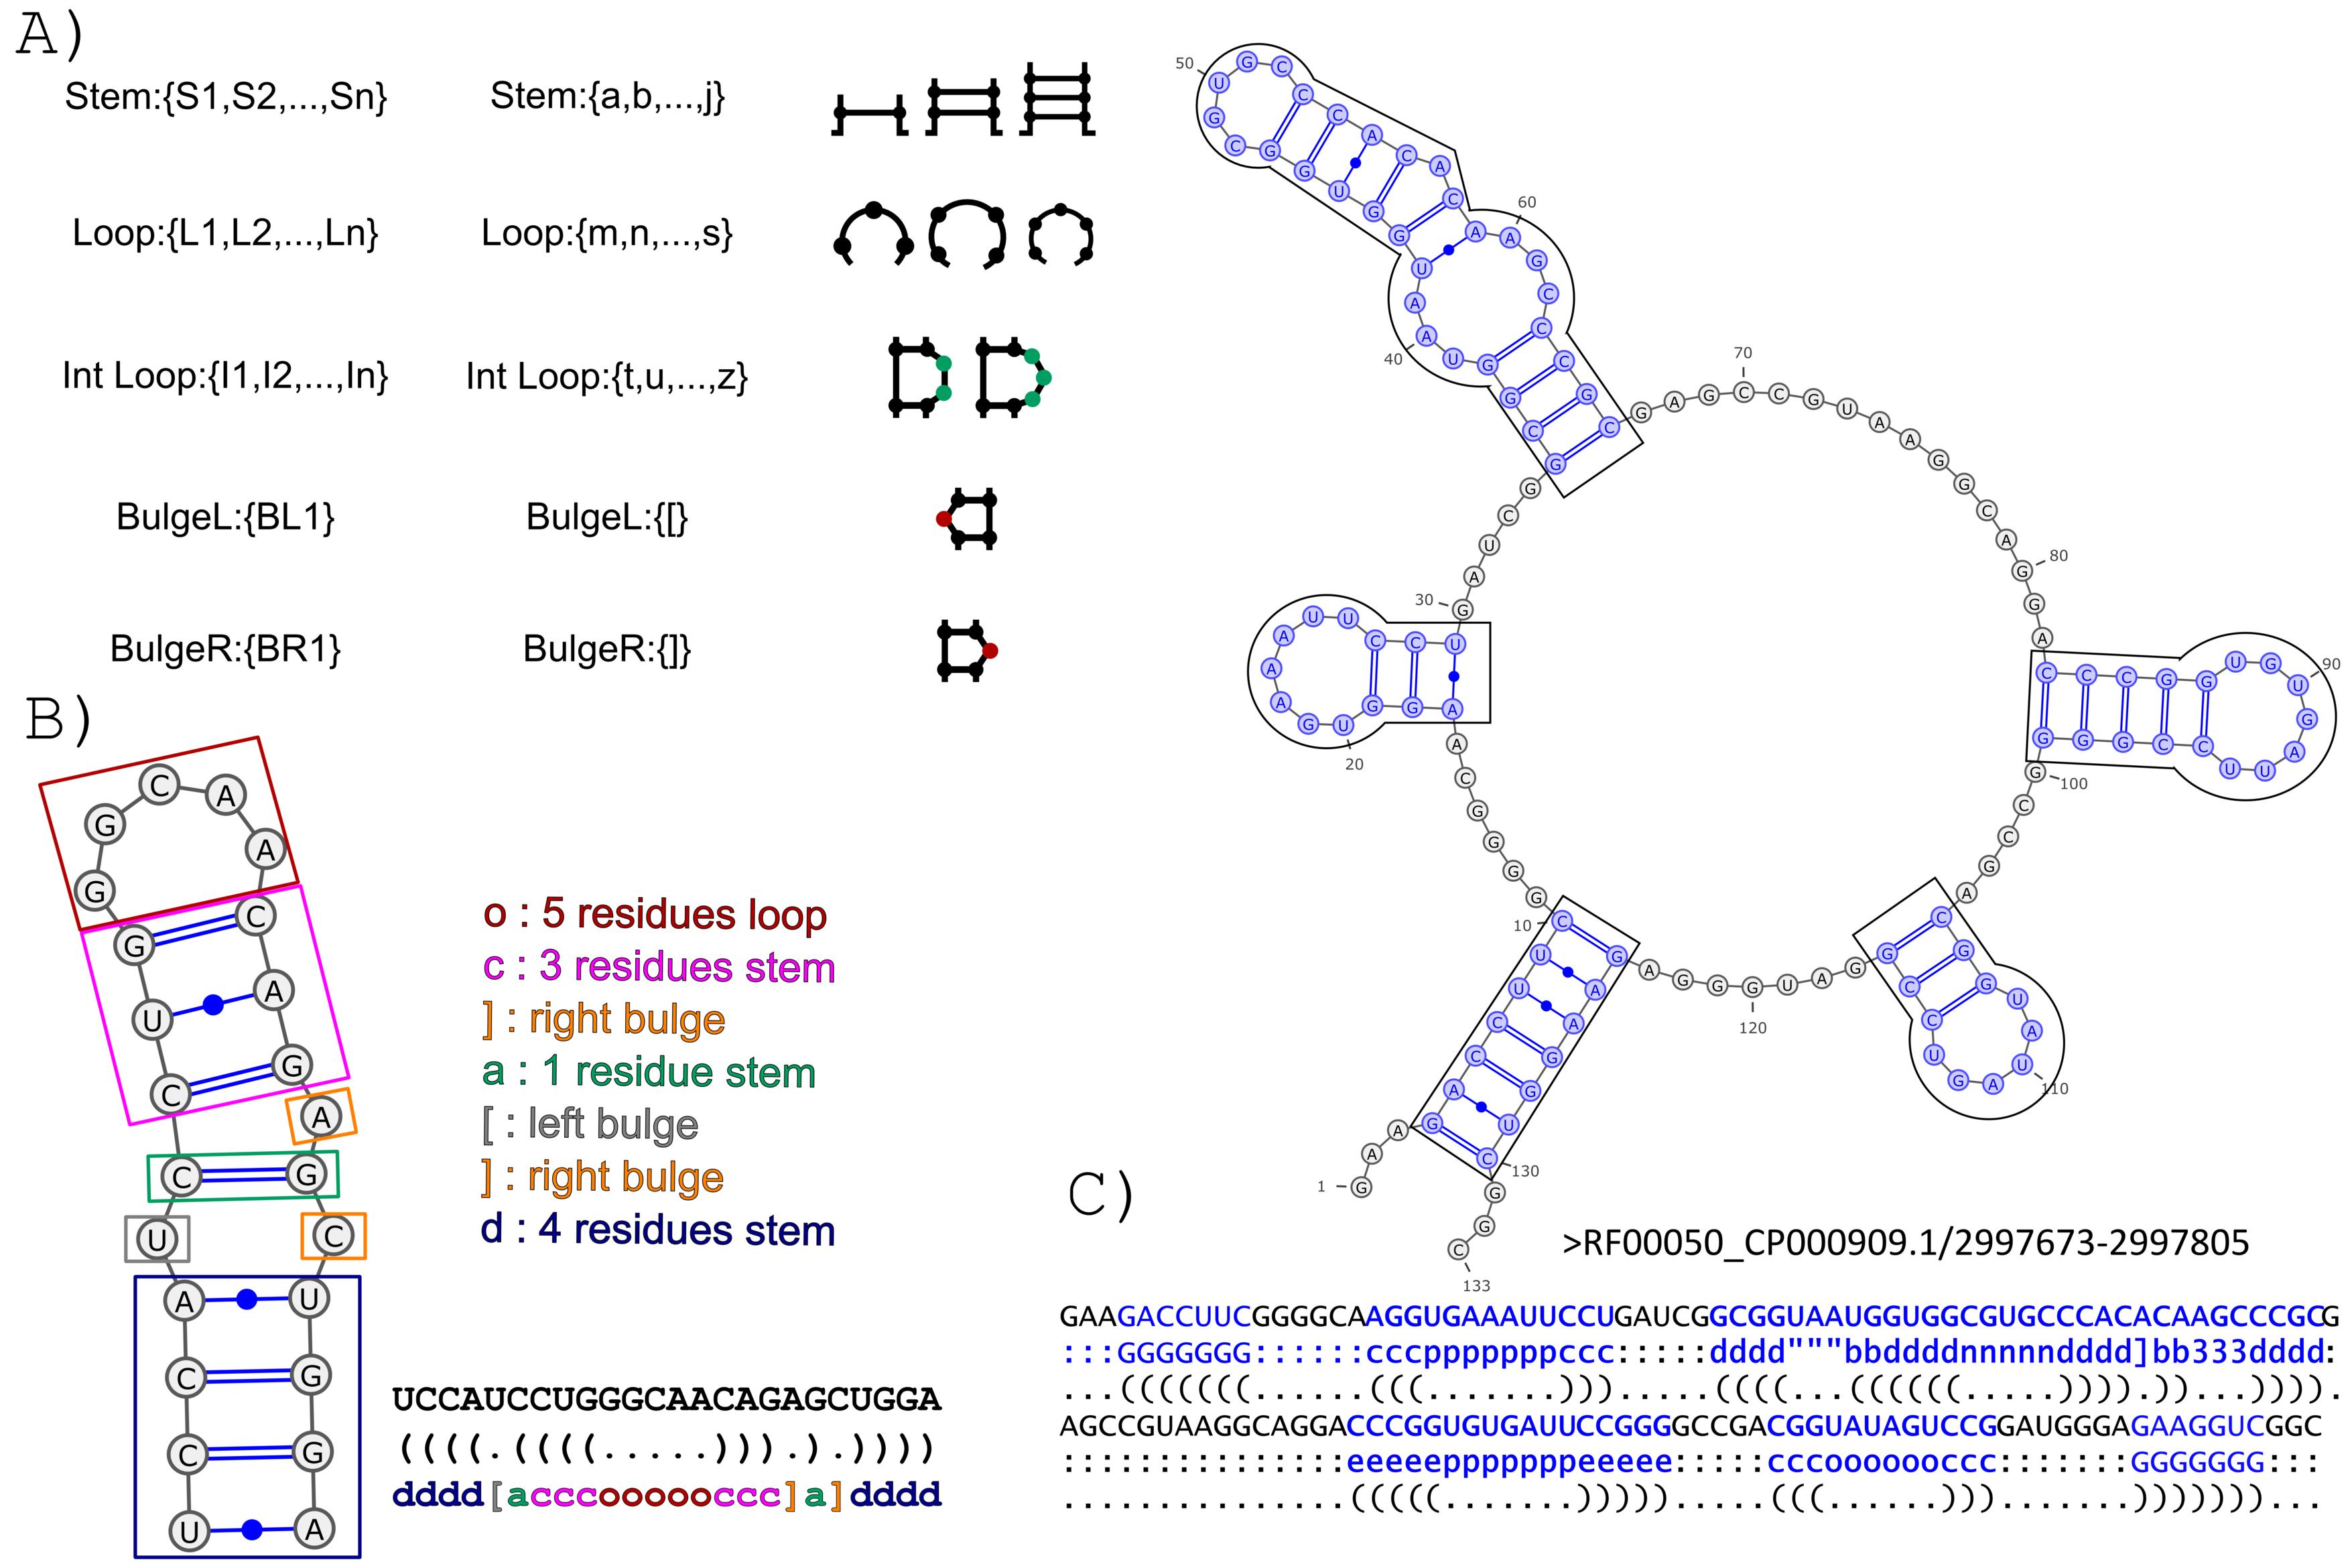
The BEAGLE (BEar Alignment Global and Local) web-server performs pairwise alignments of RNA secondary structure. The method exploits a new encoding for RNA secondary structure (BEAR) and a substitution matrix for RNA structural elements (MBR) (Mattei et al., 2014). The BEAR encoding allows to include structural information within a string of characters where each character of the encoding stores the information about the type and length of the secondary structure elements the nucleotide belongs to (Fig. 1).
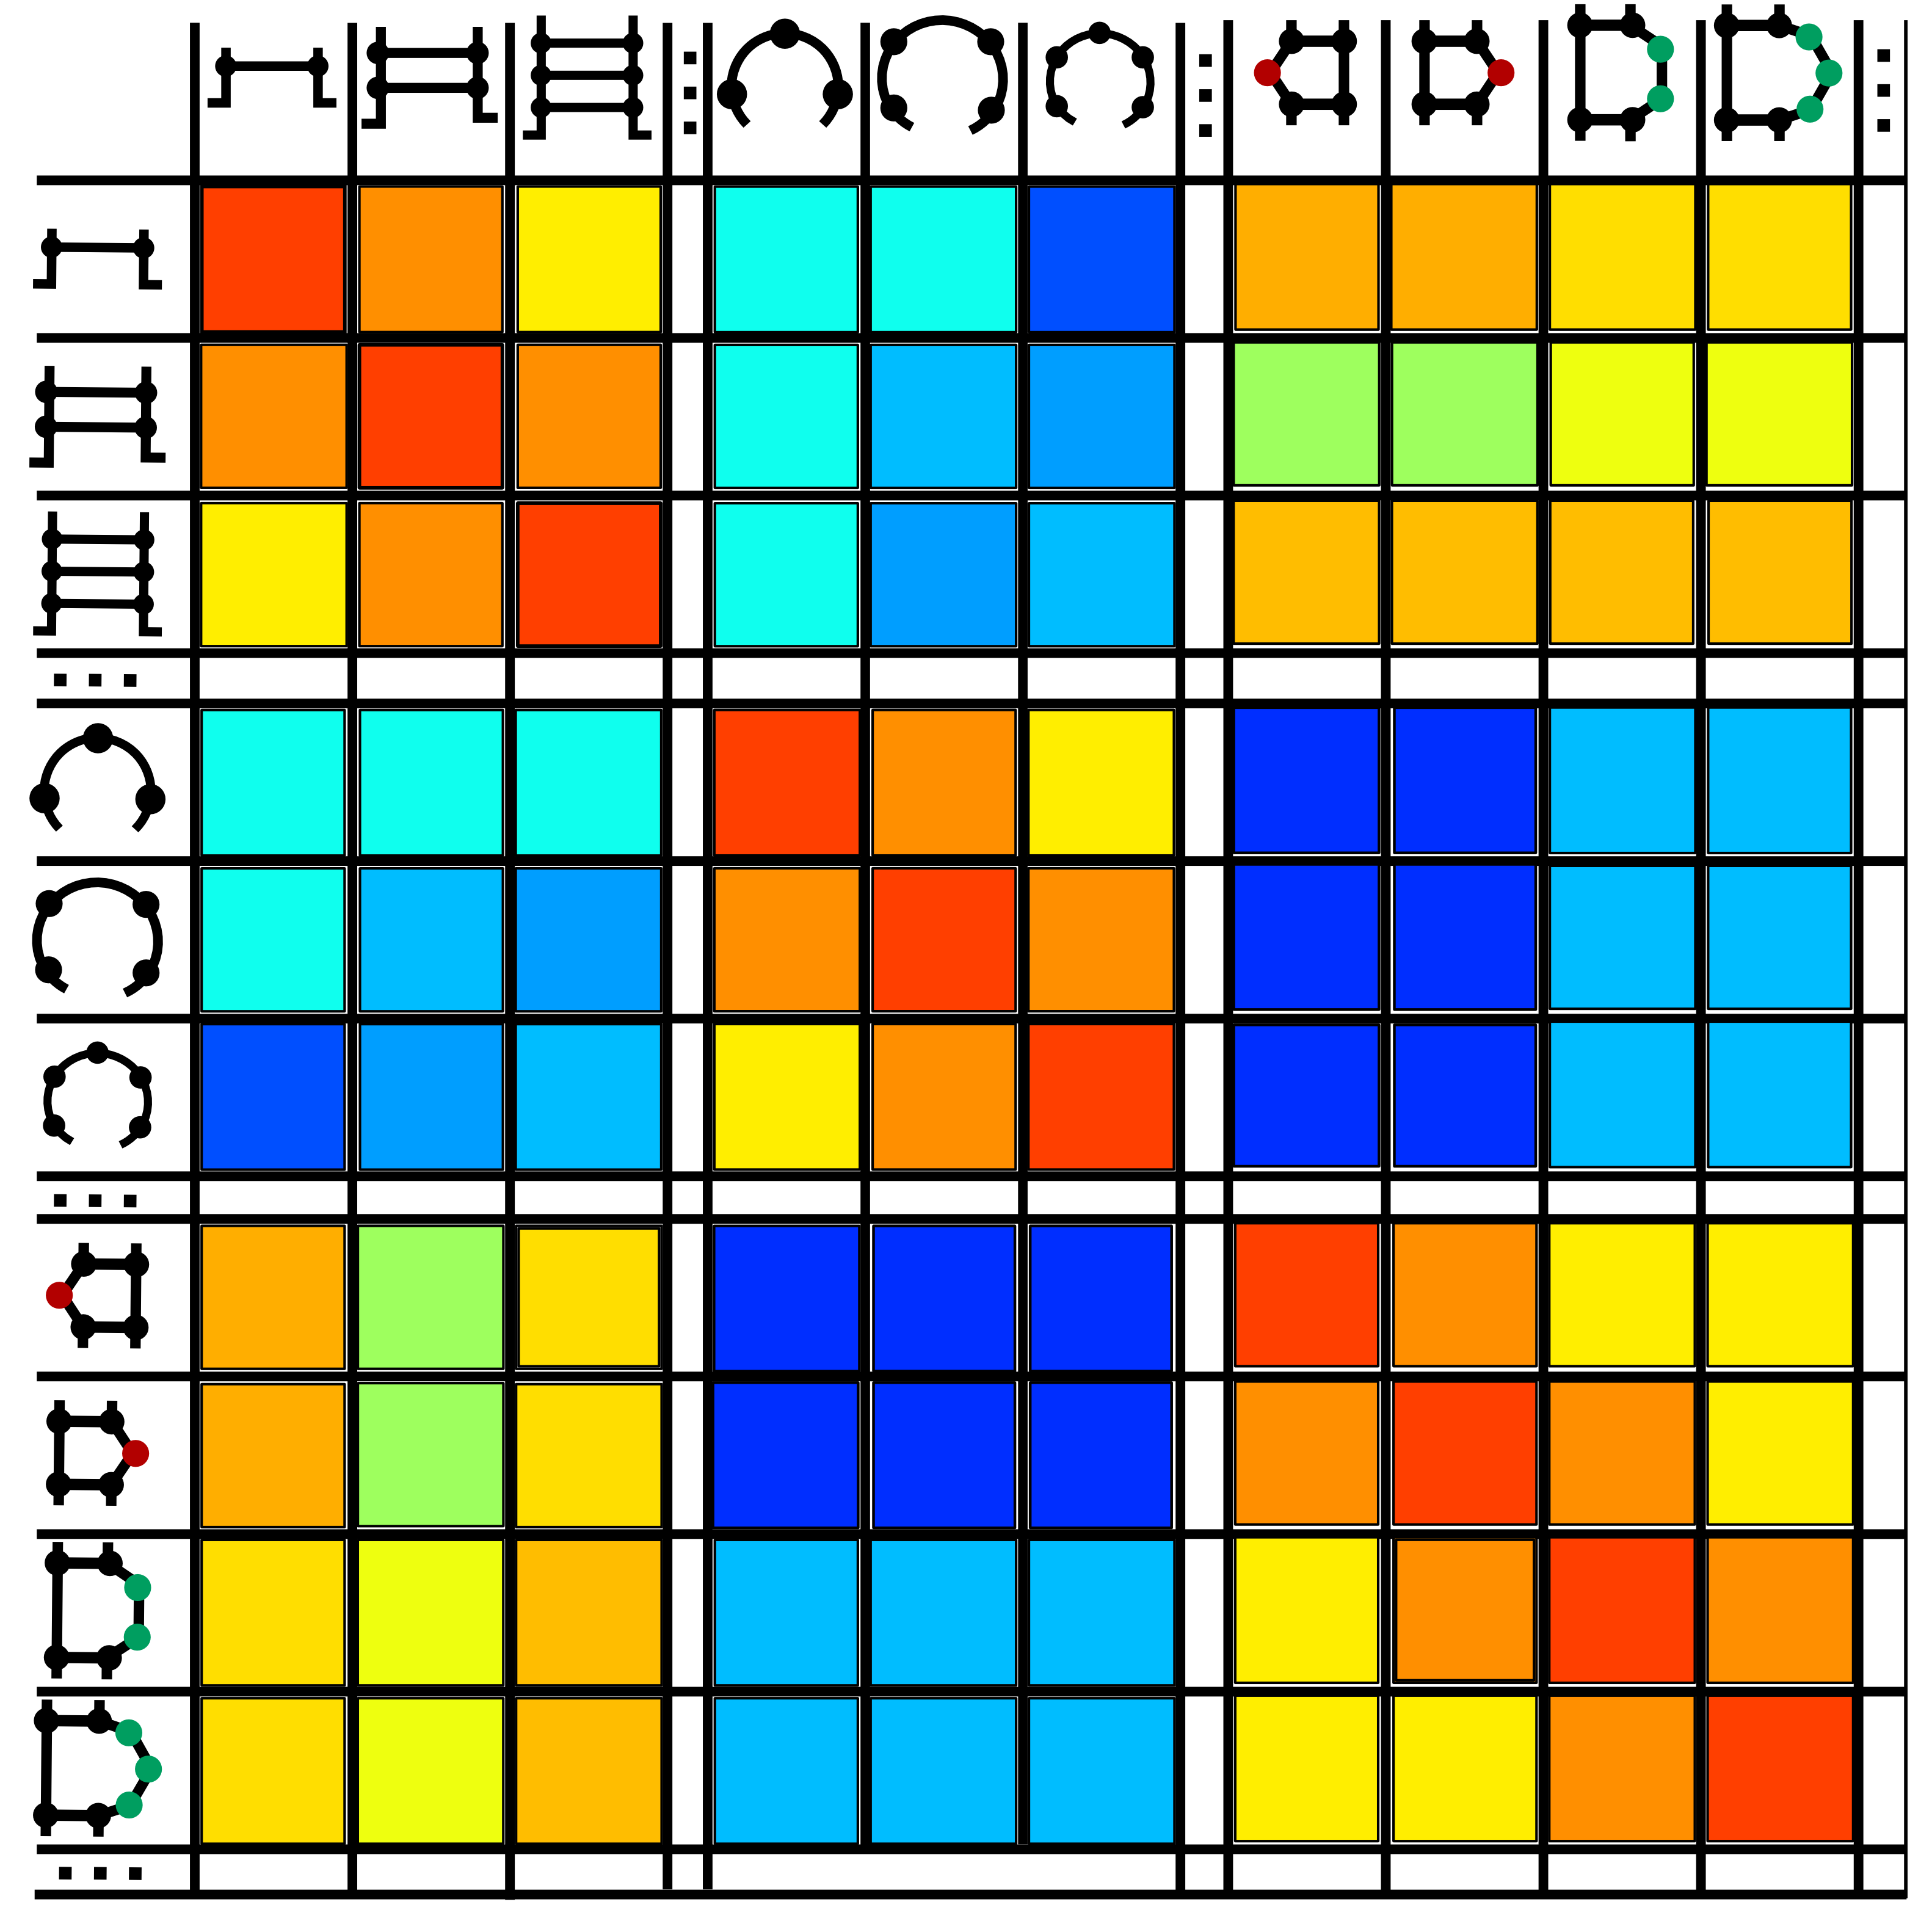
Transition rates between secondary structure elements were computed on a set of evolutionally related BEAR-encoded RNAs (Fig.2).
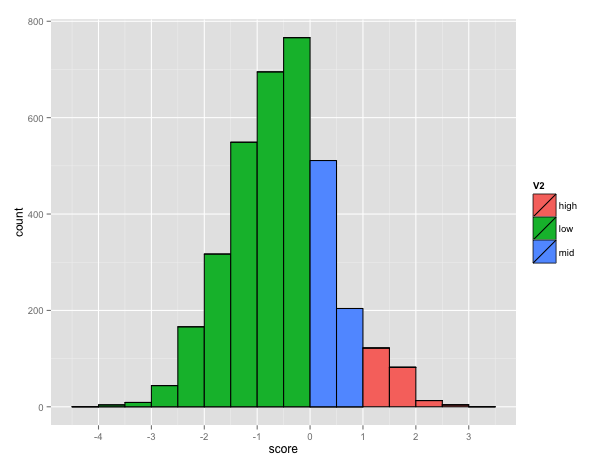
The BEAR encoding uses an alphabet of 83 characters so the size of the MBR is 83x83. The total number of possible pairs is 3486 (83*(83+1)/2) among which 221 has a score higher than 1, corresponding to pairs occurring more than expected. The plot below shows the distribution of the score in the matrix (Fig. 3).
The BEAGLE method implements a modified version of the the Needleman-Wunsch algorithm for global alignment and the Smith-Waterman algorithm for local alignment, for the comparison of BEAR-encoded RNA secondary structures, using the MBR (or any other user-provided substitution matrix for BEAR characters) to guide the alignment.
Transition rates between secondary structure elements were computed on a set of evolutionally related BEAR-encoded RNAs (Fig.2).
The BEAR encoding uses an alphabet of 83 characters so the size of the MBR is 83x83. The total number of possible pairs is 3486 (83*(83+1)/2) among which 221 has a score higher than 1, corresponding to pairs occurring more than expected. The plot below shows the distribution of the score in the matrix (Fig. 3).
The BEAGLE method implements a modified version of the the Needleman-Wunsch algorithm for global alignment and the Smith-Waterman algorithm for local alignment, for the comparison of BEAR-encoded RNA secondary structures, using the MBR (or any other user-provided substitution matrix for BEAR characters) to guide the alignment.
BEAGLE offers three kinds of comparisons:
- One set This option accepts one set of RNAs as input and the server will perform all the possible pairwise alignments among those RNAs. Maximum 300 RNAs accepted in input. The input sequences must be supplied using the textarea.
- Two sets This option accepts two sets of RNAs, namely the query and target set. The sequences in the query set will be aligned to the sequences in the target set. For more information about the comparison modes available see the parameters section. The input sequences must be supplied using the two textareas.
- Search Using this option, an input RNA will be compared to one of the five pre-compiled RNA datasets, namely human lncRNAs, mouse lncRNAs, human 3' UTR, mouse 3'UTR and structured Rfam. For more information about the available datasets see the datasets section.
All the comparison options required the input sequences to be supplied using the textarea in the home page.
The input sequences are accepted in FASTA format:
-The line containing the name and/or the description of the sequence starts with a ">";
-The words following the ">" are interpreted as the RNA id;
-The following line reports the RNA nucleotide sequence; -The subsequent line characters are interpreted as secondary structure information (Optional)
or
FASTB format:
-The line containing the name and/or the description of the sequence starts with a ">";
-The words following the ">" are interpreted as the RNA id;
- The following line reports the RNA nucleotide sequence;
-The subsequent line characters are interpreted as secondary structure information in the BEAR alphabet.
The IUPAC notation is accepted for nucleotides (case-insensitive).
The secondary structure must be supplied using dot-bracket notation; only '( . )' characters will be accepted by the program.
Example of a well formatted input file:
>X06054.1/711637
GGGCCCGUCGUCUAGCCUGGUUAGGACGCUGCCCUGACGCGGCAGAAAUCCUGGGUUCAAGUCCCAGCGGGCCCA
In this case the secondary strucure for the sequence will be computed on the fly using RNAfold (Vienna package), with the minimum free energy prediction method.
or
>X06054.1/711637
GGGCCCGUCGUCUAGCCUGGUUAGGACGCUGCCCUGACGCGGCAGAAAUCCUGGGUUCAAGUCCCAGCGGGCCCA
(((((((..((((..........)))).(((((.......))))).....(((((.......)))))))))))).
or
>X06054.1/711637
GGGCCCGUCGUCUAGCCUGGUUAGGACGCUGCCCUGACGCGGCAGAAAUCCUGGGUUCAAGUCCCAGCGGGCCCA
(((((((..((((..........)))).(((((.......))))).....(((((.......)))))))))))).
GGGGGGG::ddddssssssssssdddd:eeeeepppppppeeeee:::::eeeeepppppppeeeeeGGGGGGG:
The input may contain many sequences e.g. :
>X06054.1/711637
GGGCCCGUCGUCUAGCCUGGUUAGGACGCUGCCCUGACGCGGCAGAAAUCCUGGGUUCAAGUCCCAGCGGGCCCA
(((((((..((((..........)))).(((((.......))))).....(((((.......)))))))))))).
GGGGGGG::ddddssssssssssdddd:eeeeepppppppeeeee:::::eeeeepppppppeeeeeGGGGGGG:
>AP000063.1/5917959095
GCGGGGGUGCCCGAGCCUGGCCAAAGGGGUCGGGCUCAGGACCCGAUGGCGUAGGCCUGCGUGGGUUCAAAUCCCACCCCCCGCA
(((((((..(((.............))).(((((.......)))))..............(((((.......)))))))))))).
>AP000989.1/7327973354
GCGGCCGUCGUCUAGUCUGGAUUAGGACGCUGGCCUUCCAAGCCAGUAAUCCCGGGUUCAAAUCCCGGCGGCCGCA
(((((((..((((...........)))).(((((.......))))).....(((((.......)))))))))))).
>AE006696.1/291218
GCCGCCGUAGCUCAGCCCGGGAGAGCGCCCGGCUGAAGACCGGGUUGUCCGGGGUUCAAGUCCCCGCGGCGGCA
(((((((..((((.........)))).(((((.......))))).....(((((.......)))))))))))).
GAP INSERTION
Cost of starting a gap in the alignment
GAP EXTENSION
Cost of extending an alignment gap.
SEQUENCE BONUS
Extra score for aligning two identical nucleotides.
GLOBAL/LOCAL
Allows the user to choose between global and local alignment
DATASETS (only for "Search" comparison option)
Allows the user to choose one of the pre-compiled datasets. Graphical output will not be available for this option.
COMPARISON METHOD (only for "Two sets" comparison option)
In the "All vs. All" mode, each RNA in the query set will be aligned with each RNA in the target set producing n x m alignments where n is the cardinality of the query set and m is the cardinality of the target set.
In the "One to One" mode, the first RNA in the query set will be aligned with the first RNA in the target, the second RNA in the query set with the second of the target set and so on and so forth. The cardinalities of the two sets must be equal. In both cases max 10 000 alignments are allowed.
- Human lncRNAs This dataset consists in all the Human lncRNAs smaller than 10000 nucleotides, folded using RNAfold (minimum free energy method) program from Vienna package. The lncRNA were retrieved from the GENCODE website; release 22 (GRCh38.p2).
- Mouse lncRNAs This dataset consists in all the Mouse lncRNAs smaller than 10000 nucleotides, folded using RNAfold (minimum free energy method) program from Vienna package. The lncRNA were retrieved from the GENCODE website; release M4 (GRCm38.p3).
- Human 3' UTR This dataset consists in all the Human 3' UTR. The sequences along with their secondary structures were downloaded using the "Table Browser" tool from UCSC. Assembly:GRCh38/hg38; Track:UCSC Genes; Table:foldUTR3.
- Mouse 3' UTR This dataset consists in all the Mouse 3' UTR. The sequences along with their secondary structures were downloaded using the "Table Browser" tool from UCSC. Assembly:GRCm38/mm10; Track:UCSC Genes; Table:foldUTR3.
- Structured Rfam This dataset consists in all the RNAs from Rfam (v.11) belonging to a family annotated with a consensus secondary structure. We used RNAfold (minimum free energy method) to fold all the Rfam RNAs. In order to improve the prediction accuracy, for each RNA we used as structural constraints for the folding the consensus secondary structure of its belonging family as described previously (Mattei et al., 2014).
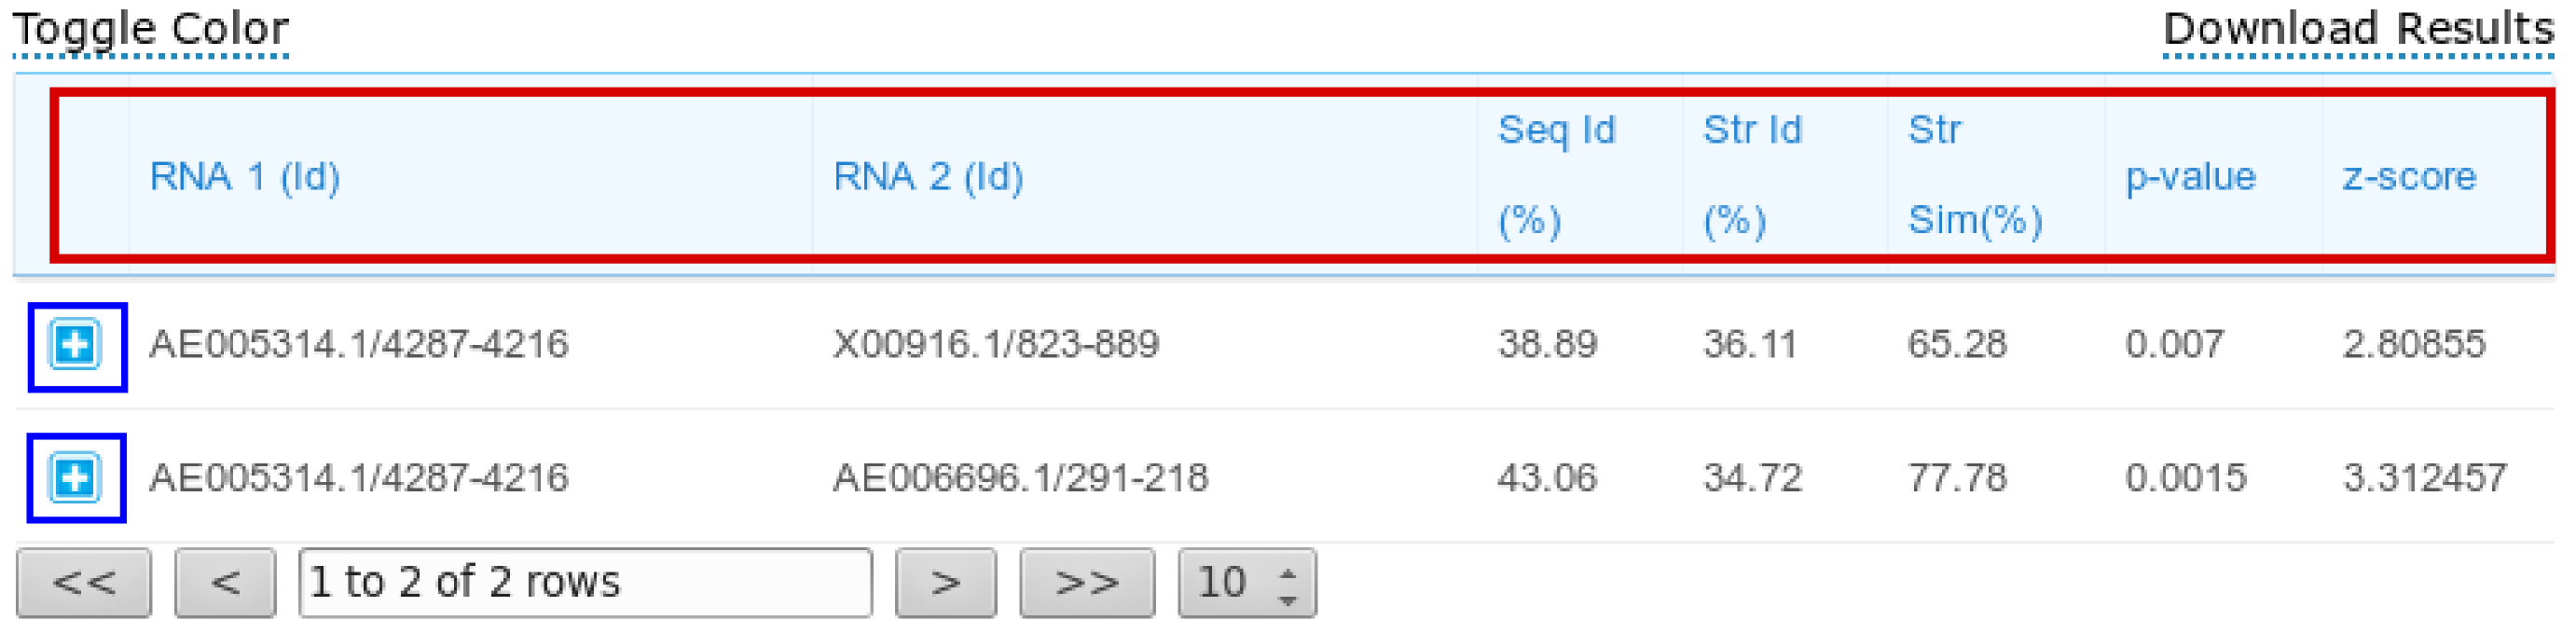
The results page reports a table containing all the computed pairwise alignments. Each row of the table contains the two input RNA ids and alignment statistics such as sequence and structural identity percentages and the structural similarity percentage. Moreover, also two measures for the statistical significance of the alignments are reported: p-value and z-score. Results can be sorted according to one of the previous parameters by clicking the selected column header (one of the parameters inside the red box in the figure below).
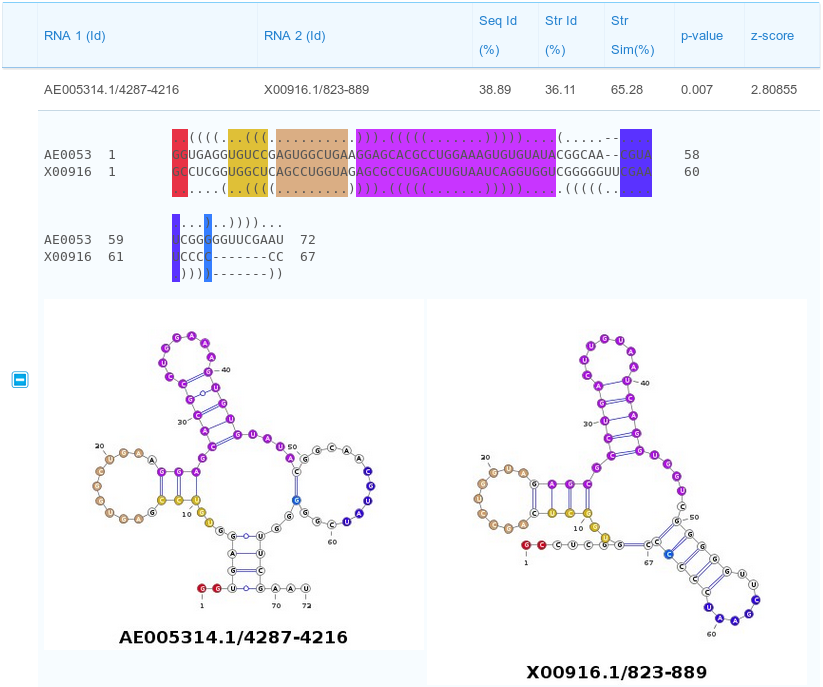
Description of the alignment scores:
The Str Id (structural identity percentage) is computed as the fraction of paired bases encoded with an identical BEAR character.
The Str Sim (structural similarity percentage) is computed as the fraction of paired bases encoded with two different BEAR characters belonging to the same RNA structural element (e.g. two different characters ancoding for stems with different lengths).
The p-value and z-score are computed using as background the distribution of the scores obtained aligning unrelated RNA sequences(as detailed in the Supplementary Material of Mattei et al., sumbitted). We suggest to consider the z-score as the reference statistic measure and consider as significant all the alignments having a z-score higher than 3.
By clicking on export results, it is possible to download all the pairwise alignments. The exported file will be formatted in a FASTA-like format as follow:
-The first line containing starts with a ">" followed by the name of the first sequence, the name of the second and the alignment scores divided by '|'
-Next line represents the aligned nucleotide sequence of the first RNA
-Next line represents the aligned secondary structure of the first RNA
-Next line represents the aligned BEAR characters of the first RNA
-Next line represents the aligned nucleotide sequence of the second RNA
-Next line represents the aligned secondary structure of the second RNA
-Next line represents the aligned BEAR characters of the second RNA
Example:
Input1:>X06054 GGGCCCGUCGUCUAGCCUGGUUAGGACGCUGCCCUGACGCGGCAGAA (((((((..((((..........)))).(((((.......)))))..Input2:
>AP000063
GCGGGGGUGCCCGAGCCUGGCCAAAGGGGUCGGGCUCAGGACCCGAU
(((((((..(((.............))).(((((.......))))).
Output:
>X06054|AP000063|NW:83.56|SeqIdentity:44.71|StrIdentity:67.06|StrSimilarity:84.71|P-value:0.007|Z-score:2.80855
# the name of the first sequence, the name of the second, the alignment score, the sequence identity
 percentage, the structural identity percentage, the structural similarity percentage, P-value,
  Z-score, divided by '|'
GGGCCCGUCGUCUAGCCUGG-UUAGGACGCUGCCCUGACGCGGCAGAA #primary sequence first sequence
(((((((..((((.......-...)))).(((((.......))))).. #secondary structure first sequence
GGGGGGG::ddddsssssss-sssdddd:eeeeepppppppeeeee:: #BEAR encoding first sequence
GCGGGGGUGCCCGAGCCUGGCCAAAGGGGUCGGGCUCAGGACCCGAU  #primary sequence second sequence
(((((((..(((.............))).(((((.......))))).  #secondary structure second sequence
GGGGGGG::cccvvvvvvvvvvvvvccc:eeeeepppppppeeeee:  #BEAR encoding second sequence